
Although Amazon’s Brand Metrics has been around for a while, many sellers have yet to take full advantage of this powerful tool. This comprehensive measurement solution offers a treasure trove of consumer information, helping marketers analyze our brand’s performance during each stage of the customer journey, from brand awareness to purchase.
By the end of this article you will have the answer for the following questions (and many more):
- What are the segments of the sales funnel and what kind of metrics help you measure your performance on each of them?
- How do you compare to your category top / median?
- What steps should you follow to get closer to your category top?
- What metrics should we look at to understand the long-term value of our customers (-> customer lifetime value)?
Let’s see at first where you find the brand metrics data. You should navigate to your Advertising Console, where you have the Insights and Planning tab in your left hand menu. And there you click on Brand Metrics.
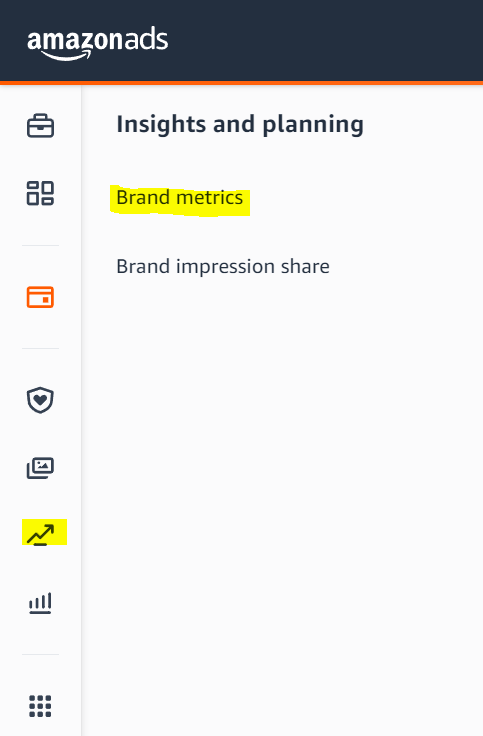
Right here you can find your funnel performance metrics, which gives you a high level of analysis of your overall sales funnel.
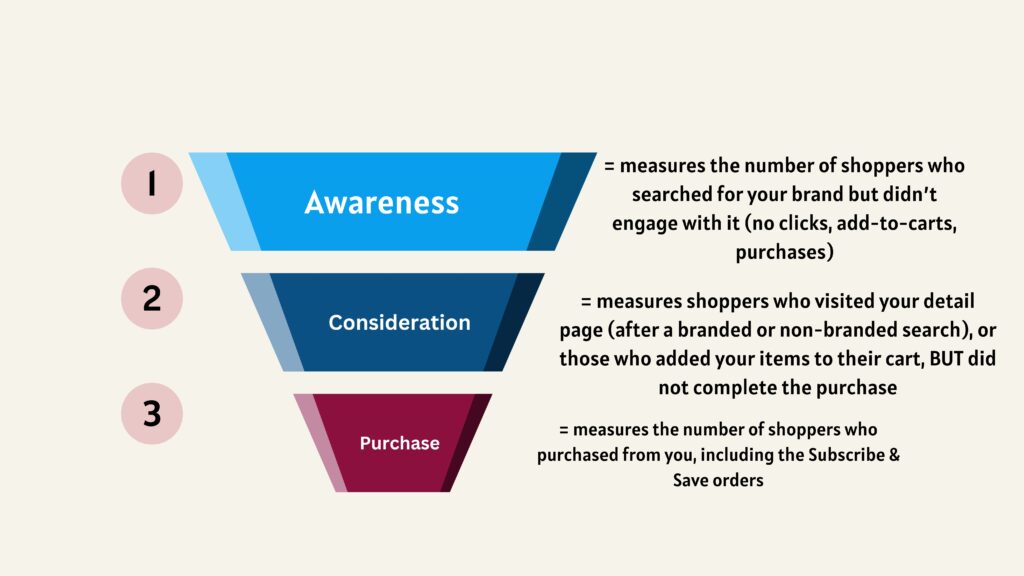
Below you can see the different segments of the sales funnel and Amazon’s definition for each of them:
In order to see more detailed information about these segments click on “View detailed metrics for your brand in this category.”
Here you will see your Overall Category Metrics:
- Shopper Engagement Rate:
The percentage of total shoppers in your category that engaged with your brand (clicks, ADT, Purchases)
- New-to-brand customers:
This number is going to be pretty high for those brands who are not selling consumable products
- Customer Conversion Rate:
The percentage of customers who moved from considering your brand to purchasing from your brand.
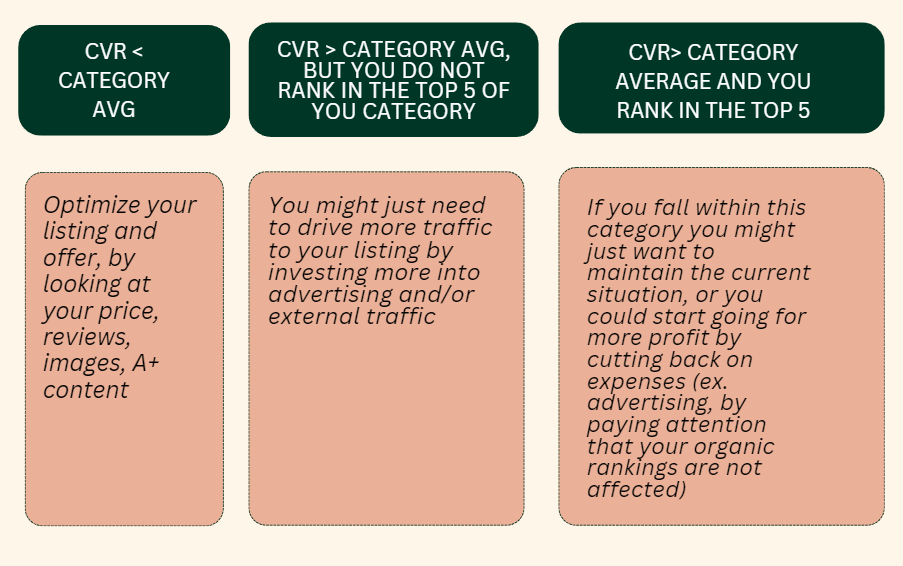
Regarding your CVR, it is crucial to compare it to your category median and category top. The same CVR might be great for one category but too low for another. Furthermore, benchmarking against your competitors can help you develop the right strategy in terms of advertising, pricing, etc. Here are three possible scenarios regarding your CVR, one of which might apply to your brand:
As you continue scrolling, you’ll encounter a more detailed analysis of your sales funnel, including specific metrics to gauge your performance at each stage. Here’s a brief overview + some actionable strategies for each stage on how you can maximize your performance.
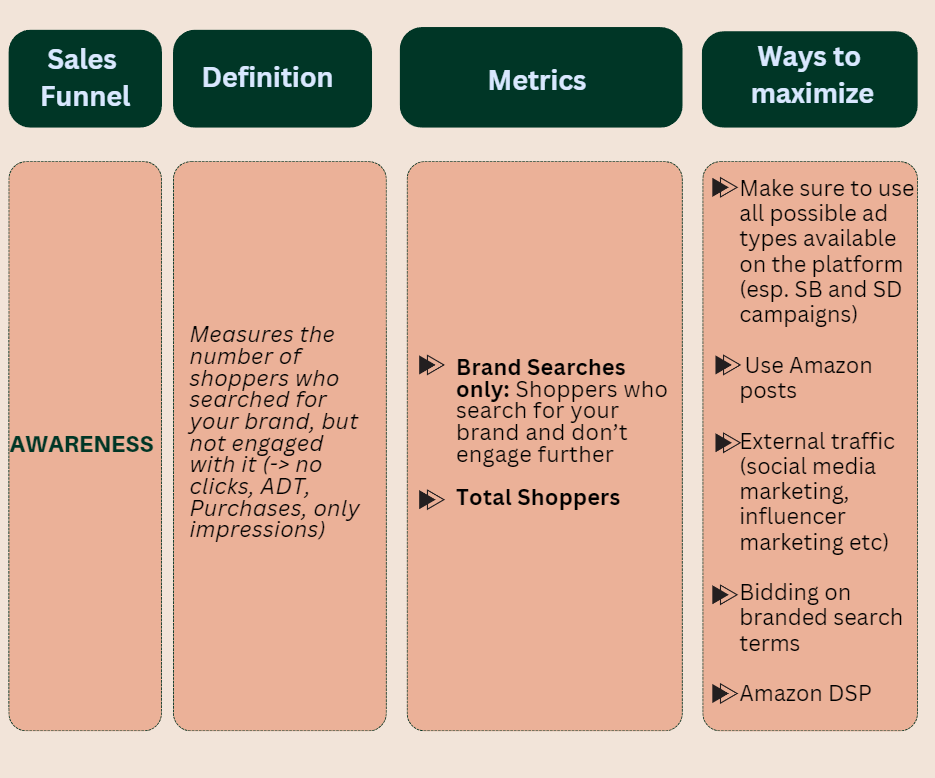
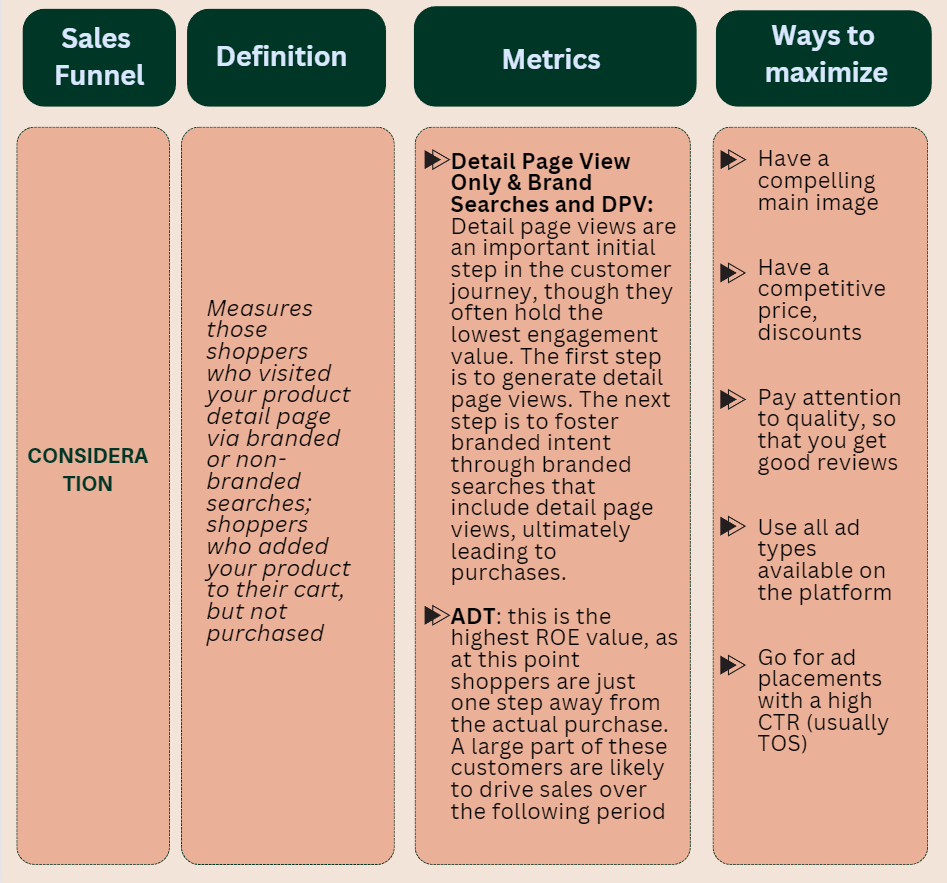
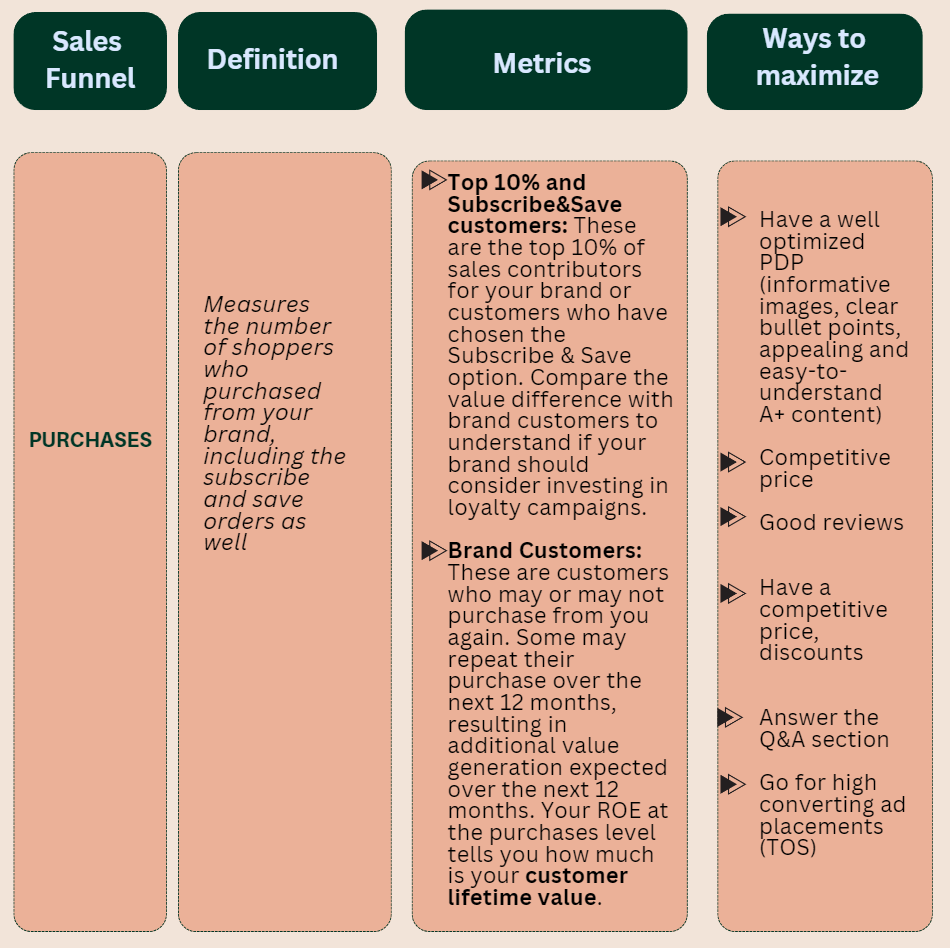
It’s crucial not to view these metrics in isolation; always consider them within the context of your data and analyze them collectively. This approach allows for a comprehensive understanding of your brand’s evolution and positioning relative to competitors.
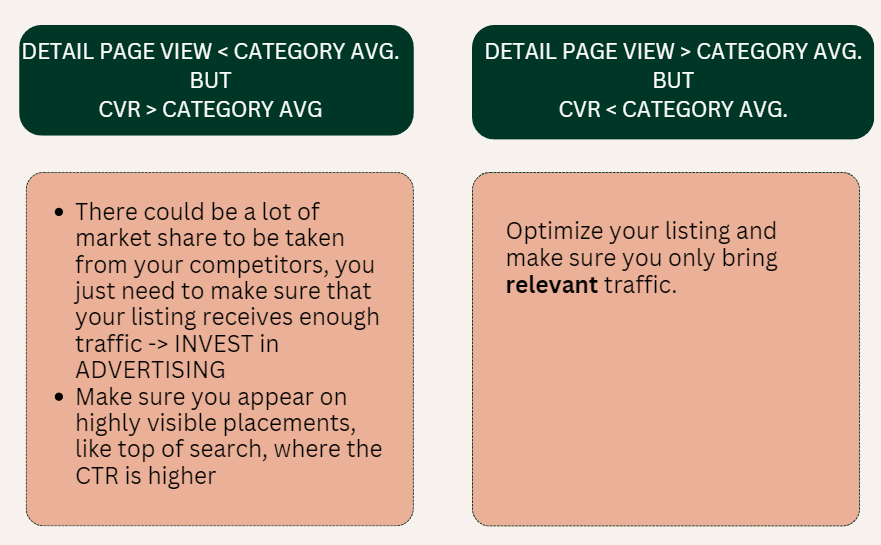
For example, analyzing the Detail Page View Only metric alongside your Conversion Rate can provide some really valuable insights:
So, that’s Amazon’s Brand Metrics in a nutshell. If you’re interested in learning more, be sure to check out my YouTube video where I dive into these topics in more detail.